DP projections from PwC: how China, India and Brazil will overtake the West by 2050
GDP projections from consultancy PwC show how the US, UK and the west will fall far behind the new economic powers like China in GDP by 2050. See what the data says
• Get the data
• Get the data
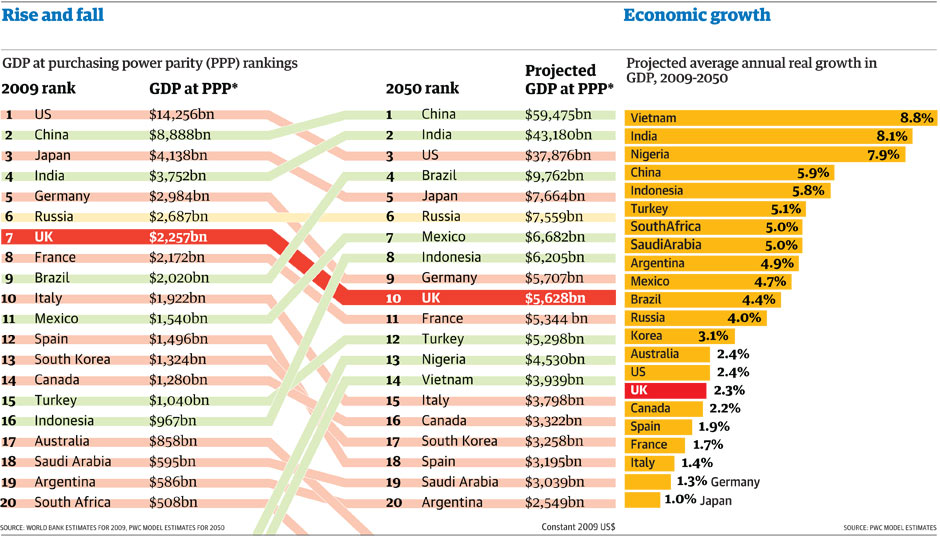
GDP projections to 2050: how the rankings change. Click image for graphic. Illustration: Jenny Ridley for the Guardian
What will the world look like in 2050? For a number of years, the economists at PwC have been charting the rise of the big emerging countries and seeking to calculate the moment when the G7 industrial nations will be surpassed by an E7 (E for Emerging) of China, India,Brazil, Russia, Mexico, Indonesia and Turkey.
To do this, they used World Bank data for growth up until 2009, PwC's short-term projections for the years up until 2014 and their long-term growth assumptions for 2015 to 2050, which rely on assumptions about population growth, increases in human and physical capital, and the rate at which poorer countries can catch up with the more advanced technologies used in developed nations.
Inevitably, the results of the study involve guess work, however well-informed. But the trends appear to be clear; the emerging nations have grown far more rapidly than their counterparts in the west and will continue to do so.
At present, nine out of the ten biggest economies in the world when measured by market exchange rates are developed nations; by 2050, according to PwC, that number will be down to just four - the US at number two behind China, Japan at 5, Germany at 8 and the UK at 9. PwC also make comparisons using purchasing power parities - which take account of different price levels between countries.
Using this yardstick, the eclipse of the west happens more quickly, although the broad trends are similar, with the US falling to third behind China and India by 2050 and the UK in 10th place, one place below Indonesia.
Thanks to PwC the key data is below. What can you do with it?
Nenhum comentário:
Postar um comentário